Measuring the impact of AI on engineering
— not just its adoption
My role
Senior Product Designer
End-to-end design
Duration
3 months
Team
2 Product Managers
1 Analytics
6+ Developers

AI Insights

![893633-[Converted].png](https://static.wixstatic.com/media/00dc03_3726f49898a04feb8ec8315635f09c10~mv2.png/v1/fill/w_1110,h_698,al_c,q_90,usm_0.66_1.00_0.01,enc_avif,quality_auto/893633-%5BConverted%5D.png)
Overview
Engineering organizations were rapidly adopting AI coding tools, but most available analytics stopped at usage.
LinearB had a much bigger opportunity: connect AI activity with the engineering data we already had and help leaders understand whether AI was actually improving delivery, quality and engineering efficiency.
My role was to define and design the experience end-to-end — from early metric exploration and information architecture to the final organization- and team-level product.
After launch
35%
of eligible customers activated AI Insights within the first 3 months
60%
of activated accounts returned
~40%
of engaged accounts drilled down into the underlying Metrics dashboards
Problem
Adoption was measurable. Impact wasn't.
AI-tool dashboards could tell engineering leaders how many developers were using an agent, how many suggestions it generated or how much code it produced.
But none of those numbers answered the question leadership actually cared about:
Is AI helping us ship better software, faster
— or simply generating more code?
Higher AI adoption could mean faster coding.
But it could also mean more review overhead, more rework, or quality problems appearing further downstream.
So we changed the question from: How much AI are developers using?
To: What happens to engineering performance when they use it?
Opportunity & Data
We already had the signals. They just weren't connected.
LinearB already understood the engineering workflow across Git and the organizational structure behind it.
gitStream added another layer of intelligence around code review, repository configuration and detected issues.
AI integrations gave us visibility into which agents were participating in engineering work.
Together, these signals allowed us to connect:
AI activity
↓
Code & PR activity
↓
Review & quality
↓
Delivery performance
↓
Organization → Department → Team → Developer
The opportunity
Instead of building another AI usage dashboard, we could create a measurement layer between AI adoption and engineering outcomes.
Measurement framework = Adoption + Impact (throughput + quality).
≠ “hours saved”
Exploration
What does “AI impact” actually mean?
I started by exploring a broad set of signals we could potentially turn into product metrics:
Adoption
Usage trends · active users · repository coverage
Efficiency
Suggestion acceptance · AI contribution · estimated time saved
Quality
Bugs · security · performance · readability · maintainability
Operating model
Human · AI autonomous · mixed contribution
The challenge wasn't finding enough data.
It was deciding which data users should trust.
One metric I deliberately removed
Estimated Time Saved
Early concepts translated AI activity into numbers like:
309h → 418h saved/month
It was an appealing executive metric — but our data couldn't reliably prove that those hours represented actual productivity gains.
So I moved the product toward observable behavior and downstream outcomes instead.
If we couldn't explain how a number was produced, it shouldn't drive a decision.


Framework
From reporting to diagnosis
The exploration resulted in 4 questions that became the information architecture of AI Insights.
01
Is AI being
used?
AI contribution across code, commits, PRs and review.
02
Is it configured effectively?
Repository and agent rule-file coverage.
03
What happens to quality?
Bugs, security, scope, readability, maintainability and performance issues.
04
Who is doing
the work?
Human, autonomous AI and mixed contribution across coding and review.
Together they created a progression:
ADOPTION →
IMPACT →
DIAGNOSIS →
ACTION
Final solution / Org
From hundreds of signals to an organization-level picture
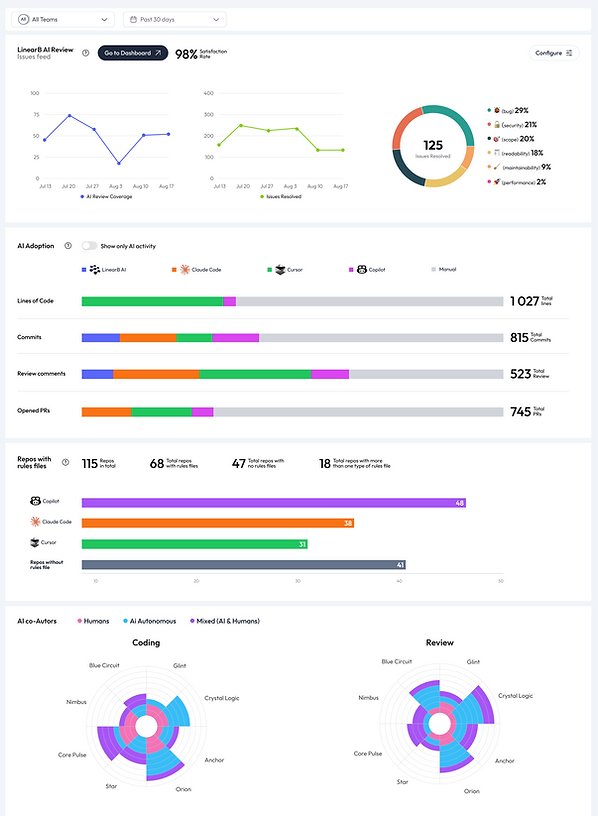
At organization and department level, individual Git events weren't useful.
A DevEx leader responsible for hundreds or thousands of engineers needed to identify patterns:
-
Where is AI adoption growing?
-
Which tools are actually contributing to engineering work?
-
Are repositories configured consistently?
-
What quality issues are appearing at scale?
-
How much work is human, autonomous or collaborative?
So I designed the organization experience around aggregated patterns across:
4 engineering activities
Code · Commits · Review · PRs
6 quality categories
Bug · Security · Scope · Readability · Maintainability · Performance
3 contribution modes
Human · AI · Mixed
At organization scale, individual events are noise. Patterns are the product.
Org → Team
Scope wasn't just a filter
One of the most important design decisions was changing the information hierarchy itself when users moved deeper into the organization.
Organization/Department
Patterns & comparison
Adoption
Coverage
Configuration
Quality trends
AI autonomy
Team
Evidence & action
Specific issue
Specific PR
Repository
Agent
Direct path to Git
The underlying data was the same.
Its value wasn't.
At executive scope, Git-level detail becomes noise.
At team scope, the same detail becomes actionable evidence.

Insight → Investigation
An insight shouldn't be a dead end
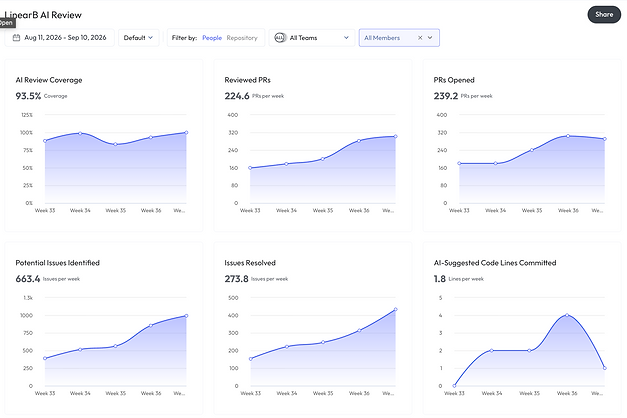
AI Insights was intentionally designed as a starting point rather than a replacement for deeper analytics.
Each major widget answered one high-level question and provided a path into the existing Metrics dashboards, where users could investigate the underlying engineering data.
This created a simple product flow:
INSIGHT
Something deserves my attention
→
DRILL DOWN
Show me the underlying data
→
METRICS
Help me understand why
After launch
~40% of engaged users drilled down from AI Insights into the underlying Metrics dashboards.
That was a strong signal that the first part of the experience worked:
Insights were successfully creating investigation intent.

Outcome
+ transition
We solved discovery.
Then we found the next bottleneck.
AI Insights helped users identify where AI behavior deserved attention.
And the ~40% drill-down rate showed that a significant share of engaged users wanted to go further.
But the destination had been designed for a different problem.
The existing Metrics dashboards were built around traditional engineering metrics — not around investigating AI impact.
Users could see the data, but answering questions such as:
-
Which AI tool is driving this change?
-
Is the effect consistent across teams and repositories?
-
How does AI-assisted work compare with non-AI work?
-
Where in the delivery process does the difference appear?
required too much manual filtering, comparison and interpretation.
The problem had moved
AI Insights
“Where should I look?”
✓ We had solved this.
↓
Existing Metrics
“Why is this happening?”
✕ The experience wasn't designed to answer it.
↓
New opportunity
AI Analytics
A dedicated investigation layer for understanding
the impact of AI on engineering performance.
